This user-friendly tool harnesses the power of Python to help you forecast revenue based on historical sales data.
How to Run the Tool:
- Prepare Your Data: Create an Excel file (.xlsx) with two columns: one labeled “Date” and the other “Revenue.” Ensure dates and numbers are formatted correctly, as otherwise it will not work as intended. You can refer to the dummy data below for the example.
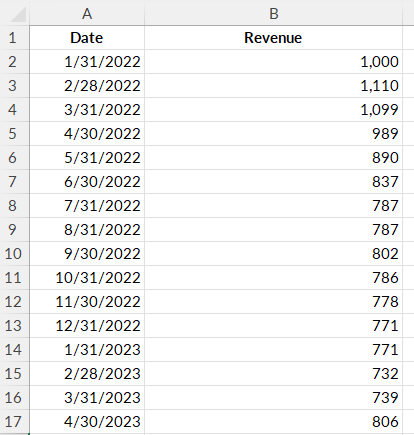
Dummy data:

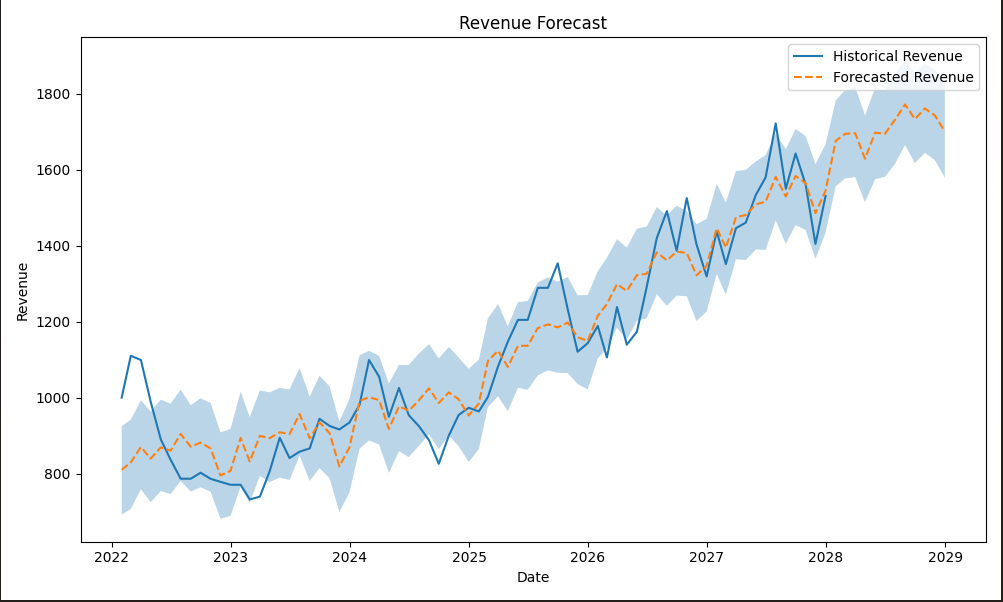
- Execute the Script: The tool cleans and validates your data, fits a forecasting model, and generates a forecast.

Key Limitations to Consider:
- Model Assumptions:
Prophet’s default settings assume that historical trends, including seasonality and growth patterns, will continue. This might not capture sudden market shifts or business-specific events (such as, marketing, discounts, and so on). - Data Quality:
The reliability of the forecast depends on clean, consistent input data. Lack of data points, outliers, missing values, or format issues can affect accuracy. - Context Matters:
This tool is intended as a baseline projection. For critical financial decisions, supplement these insights with scenario analysis and expert advice.
Confidence interval
Choose a wider interval (e.g., 95 %) when you need conservative, risk-averse estimates and a narrower one (e.g., 70 – 80 %) when you’re comfortable with more uncertainty but want tighter, clearer projections.
In summary, this revenue forecasting tool is nice starting point for planning finances and getting an idea on revenue development. However, it is important to consider its inherent limitations. Business decisions require a more sophisticated analysis and planning.
Seasonality
- Weekly – tick if your data are daily and Fridays/Saturdays (or weekdays) clearly beat others. Otherwise leave off.
- Yearly – tick when you have ≥ 24 months and the same months (e.g., December, July) reliably spike or dip. No calendar wave? Leave off.
- Both – daily data, 2 + years, and you see both weekday and holiday swings.
- Neither – data already summed weekly/monthly, or patterns are absent/unknown.
Cap (optional)
Set a cap only when you’re sure revenue physically can’t climb past a number (e.g., room capacity). Otherwise leave it 0.