
Introduction
When reviewing audit forecasts for the purpose of going concern assessment or valuation, auditors often rely on review of reasonableness of growth rates and the economic interplay between key variables. This method is robust and intuitive, playing a critical role in forecast auditing — a role that cannot be understated. Yet, this piece aims to highlight the importance of quantitative methods as a supplementary tool. These methods aren’t meant to replace logic, financial knowledge, and reasonableness approach, but to enhance it. For instance, should a quantitative method produce significantly different outcomes, it warrants further investigation to understand the discrepancy. This is especially true for going concern evaluations, which demand a detailed monthly or weekly liquidity analysis. In practice, however, many companies might struggle with such analyses due to data availability, data quality issues, or comparability challenges.
Techniques
Auditors have various techniques at their disposal, and knowing when to use each is crucial. The choice of technique depends on the data’s nature (historical or concurrent), its trends, seasonality, and cycles. For example, while regression analysis suits linear relationships within a specific range, it’s unsuitable for extrapolation. Also, techniques vary in their appropriateness and ability to “fit” the data, necessitating comparison based on metrics like the mean squared error. For auditors, accessible techniques in Excel include:
- Time series methods (e.g., simple models, Exponential Smoothing, ARIMA/SARIMA) based on historical data.
- Regression analysis to determine the impact of an independent variable on a dependent variable.
For extensive datasets, Python and associated libraries may be required.
Example 1 – Time Series
Consider an e-commerce company untouched by major economic cycles but experiencing high Christmas sales and steady growth. Despite increasing revenues, its ever-increasing losses have led to negative equity and low cash reserves, necessitating a going concern review with a focus on cash flow timing. Assume monthly sales data from 2014 to 2023 shows a steady increase and clear seasonal patterns. Using Exponential Smoothing method, we can forecast future sales in Excel by month, using Solver to adjust Alpha, Beta, and Gamma values to minimize squared error.
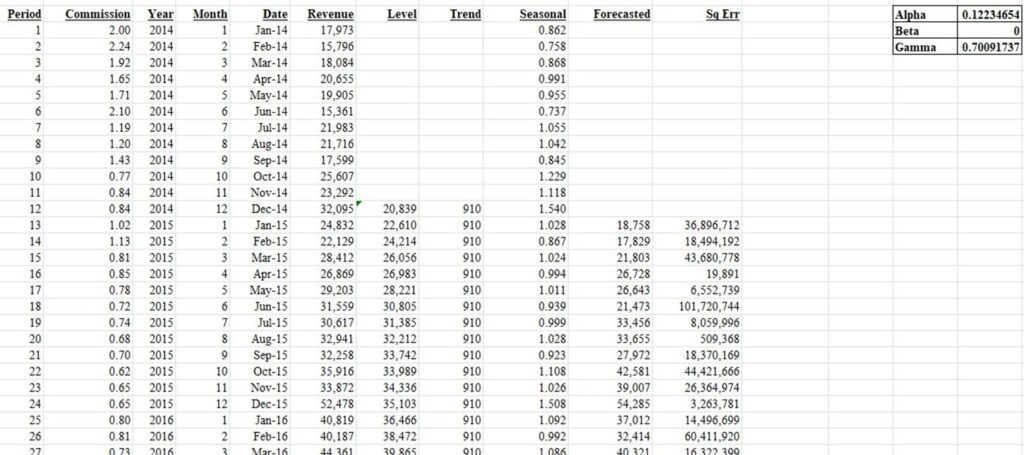
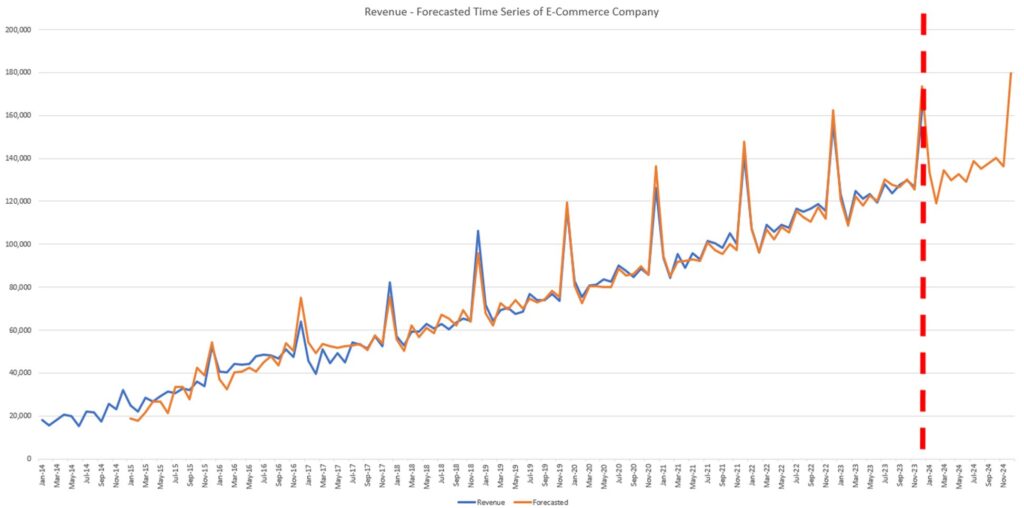
This forecast offers a detailed revenue view, crucial for assessing liquidity concerns. The model (orange line) seems to fit quite neatly also with the past actual data.
Example 2 – Regression Analysis
Imagine an oil trading company in a competitive market without significant seasonal or cyclical variations. Given that oil is largely a similar product, the key differentiatorand driver of revenue is a speed and ability to offer trading discounts to counterparties, so it is assumed that these two attributes correlate with revenue.

Let’s assume that the company also experiences cash flow issues. Projecting into FY2024, due to lack of funds, the company plans to temporarily reduce discounts to 70%, then increase them by 10% monthly from May to September, reverting to previous levels thereafter. Obtaining the relevant data from the client and performing the regression analysis would yield the following results:

After running the analysis:
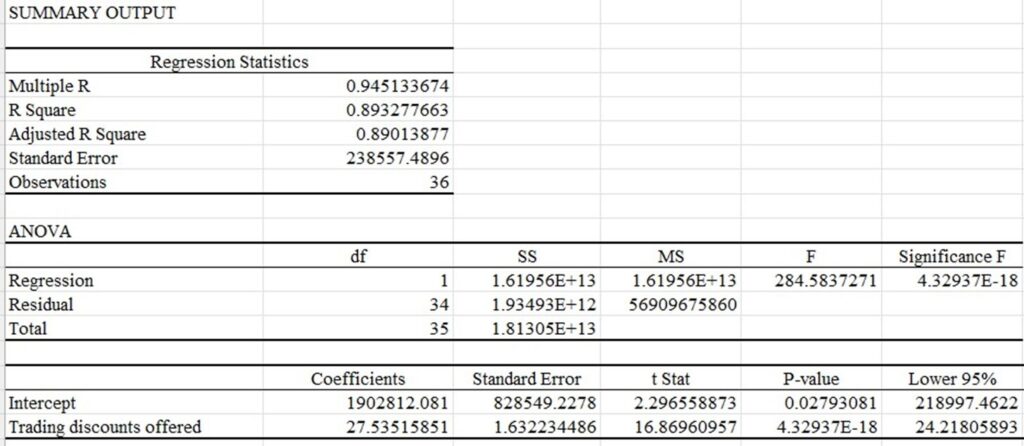
This enables us to compute forecasted values and display the results. It offers a comprehensive perspective on expected revenue, particularly beneficial for assessing liquidity in the context of going concern issues. The regression analysis reveals a predicted relationship of 1902812.08106059 + 27.5351585062049 X Trading discount offered, facilitating the calculation of both past and future values depending on the trading discounts the company plans to offer its customers in 2024.

Through this analysis, we can discern that the company may encounter financial difficulties in the early months of 2024, with a potential for liquidity stress due to significantly reduced revenues. In essence, the regression analysis delineates a clear correlation between trading discounts and revenue, laying the groundwork for forecasting.
Conclusion
While judgment, intuition, and common sense remain paramount in auditor’s review of going concern assessments and valuations, quantitative techniques offer valuable insights for challenging forecasts. When possible, auditors should explore various methods, especially when they yield divergent results, to address and align potentially unreasonable assumptions. A combined approach may be preferred to refine forecasts. In practice, however, many companies might struggle with such quantitative approaches due to data availability, data quality issues, or comparability challenges.